I created a projection system for Dugout Value to turn the latest public player data into forecasts of next season and the years beyond it. DV Projections use information through the completed 2026 season, including contact quality, plate discipline, pitching traits and minor-league performance. In historical comparisons, the system was competitive with ZiPS and Steamer for hitter wOBA and had lower pitcher FIP error than ZiPS. It now supplies the projections in the trade tools and my free-agent contract estimates.
Start with the player’s history, then look underneath it
The model reads five MLB seasons for hitters and three for pitchers. Recent seasons matter more, but a player’s latest result is only part of the evidence. For a hitter, the inputs include expected wOBA, exit velocity, barrels, hard-hit rate, launch angle, chase and contact rates, strikeouts, walks, batted-ball mix, speed, age and position. A good season supported by better contact and discipline gives the model different information from one built on a sudden rise in balls finding grass.
Pitchers get strikeout, walk and home-run rates, velocity, the quality of contact allowed, called strikes plus whiffs, pitch-quality grades and the share of their appearances made as a starter. Hitters also get up to three seasons of AAA, AA and Class A statistics, measured relative to their level’s average and paired with their age at that level. The minor-league record is especially useful when the major-league record is short.
Most hitter performance inputs and selected pitcher run estimators are relative to their season’s league average. The models learn performance relative to that season’s environment, then add a forecast league baseline based on the preceding three seasons. That helps distinguish a change in the player from a change in how much offense the league produces.
How much should a small sample count?
A month of strikeouts and a month of home runs do not contain the same amount of information. Rather than give every hitter statistic one fixed amount of regression, I supply several versions: lightly, moderately and heavily pulled toward league average. The amounts are equivalent to adding 60, 250 or 1,000 plate appearances of average performance to a recency-weighted history. The model learns which representation helps predict each target. It also sees the individual seasons, so it can distinguish a recent change from a long-standing pattern.
Pitchers get their individual seasons and an innings-weighted 3–2–1 recent-season aggregate. Those are the choices in this system; they are not descriptions of how ZiPS or Steamer work.
For each target, I average two predictions equally. Gradient-boosted trees can find nonlinear relationships and interactions between traits. Ridge regression puts tighter constraints on those relationships. Combining them was more accurate in development than relying on either alone.
Rates first, playing time separately
Hitter wOBA, strikeout rate, walk rate and isolated power are predicted separately. For pitchers, I average a direct FIP forecast with one assembled from projected strikeouts, walks plus hit batters, and home runs per inning. That lets the forecast use both an overall estimate and the components that produce it.
WAR rate has its own model, trained on FanGraphs WAR per 600 PA or 180 IP. For hitters, it includes historical fielding, baserunning and positional runs alongside the offensive inputs, as described in the next section. It is separate from my Statcast-based WAR research.
Playing time is another prediction. The trade and contract estimates use a full-season workload: the larger of the model’s expected playing time, mapped onto the scale of preseason ZiPS workloads within the player’s role, and his recent healthy workload. Healthy workload is the average of the two largest totals in the preceding three seasons, capped at 700 PA or 200 IP. Relievers have their own mapping; a larger workload must be supported by their recent history.
The arithmetic is straightforward: 6.1 WAR per 600 PA over 698 PA gives 6.1 × 698 ÷ 600 = 7.1 WAR. The assumption behind the workload matters more. A full-season valuation is useful for pricing a player, but it is not a promise that he will stay healthy or keep his job.
Defense and baserunning
DV doesn’t forecast fielding and baserunning as separate numbers. The hitter WAR-rate model sees each player’s FanGraphs fielding, baserunning and positional runs per 600 PA for each of his last five seasons, plus the same lightly, moderately and heavily regressed versions used for his hitting stats, along with his speed and position. It learns how much of each carries into next season’s WAR. The first version left these inputs out and projected the best fielders about half a win per 600 PA too low. Adding them fixed that before the projections went on the site.
Because DV forecasts total WAR, the useful comparison is whether each system’s WAR forecast gives a player the right credit for his defensive and baserunning history. I took 982 hitter-seasons from 2024–26 with 200 or more PA and forecasts from all three systems. For each system, I regressed its miss (actual WAR per 600 PA minus the forecast) on the player’s past fielding, baserunning and batting runs. A system that credits a skill correctly should leave no slope.
- Fielding: none of the three systems showed a meaningful slope. The estimates were −0.009 WAR per run of past fielding for DV, −0.005 for ZiPS and +0.005 for Steamer, each with a standard error of about .007.
- Baserunning: ZiPS and Steamer both gave too little credit, about 0.05 WAR per run of past baserunning (standard errors near .018). DV’s slope was −0.021, not distinguishable from zero. In practice, ZiPS’s forecasts for the best fifth of baserunners were too low by about half a win per 600 PA more than its forecasts for the worst fifth.
DV leaned slightly the other way: it gave the best fielders and baserunners a little too much credit relative to the worst, by about 0.2 WAR per 600 PA between the top and bottom fifths, though neither slope is distinguishable from zero. ZiPS and Steamer do publish separate defense and baserunning forecasts. ZiPS’s defense forecasts were spread too wide: players finished 0.83 runs from average for every run ZiPS projected. Both systems’ baserunning forecasts were too compressed: 1.43 runs for every projected run. These checks reuse seasons I examined while building the model, including the fielding fix, so they are exploratory.
How it compares with ZiPS and Steamer
I developed the original model recipe on 2023–24 and evaluated forecasts for 2025–26. Each forecast uses only earlier outcomes: a 2025 forecast trains through 2024; a 2026 forecast can use 2025. The comparison forecasts are archived preseason ZiPS and Steamer projections from FanGraphs, not versions updated after the season began.
For the rate test, every system is scored on the same players. Hitters need 100 MLB PA in the prior three seasons and 200 in the target season; pitchers need 20 prior innings and 40 target innings. Error is weighted by actual PA or innings, and larger misses count more heavily. The measure is root mean squared error, or RMSE: lower is better.
| Measure | DV | ZiPS | Steamer |
|---|---|---|---|
| Hitter wOBA (624 player-seasons) | .0287 | .0288 | .0288 |
| Pitcher FIP (685 player-seasons) | .728 | .763 | .731 |
The hitter results are too close to separate the systems. For pitcher FIP, DV’s error is 4.5% lower than ZiPS’s, while the gap with Steamer is inconclusive. Steamer had the lower FIP error in 2025 alone; DV had the lower error in 2026. These results support a competitive forecasting system, not a claim that it wins every statistic or every season.
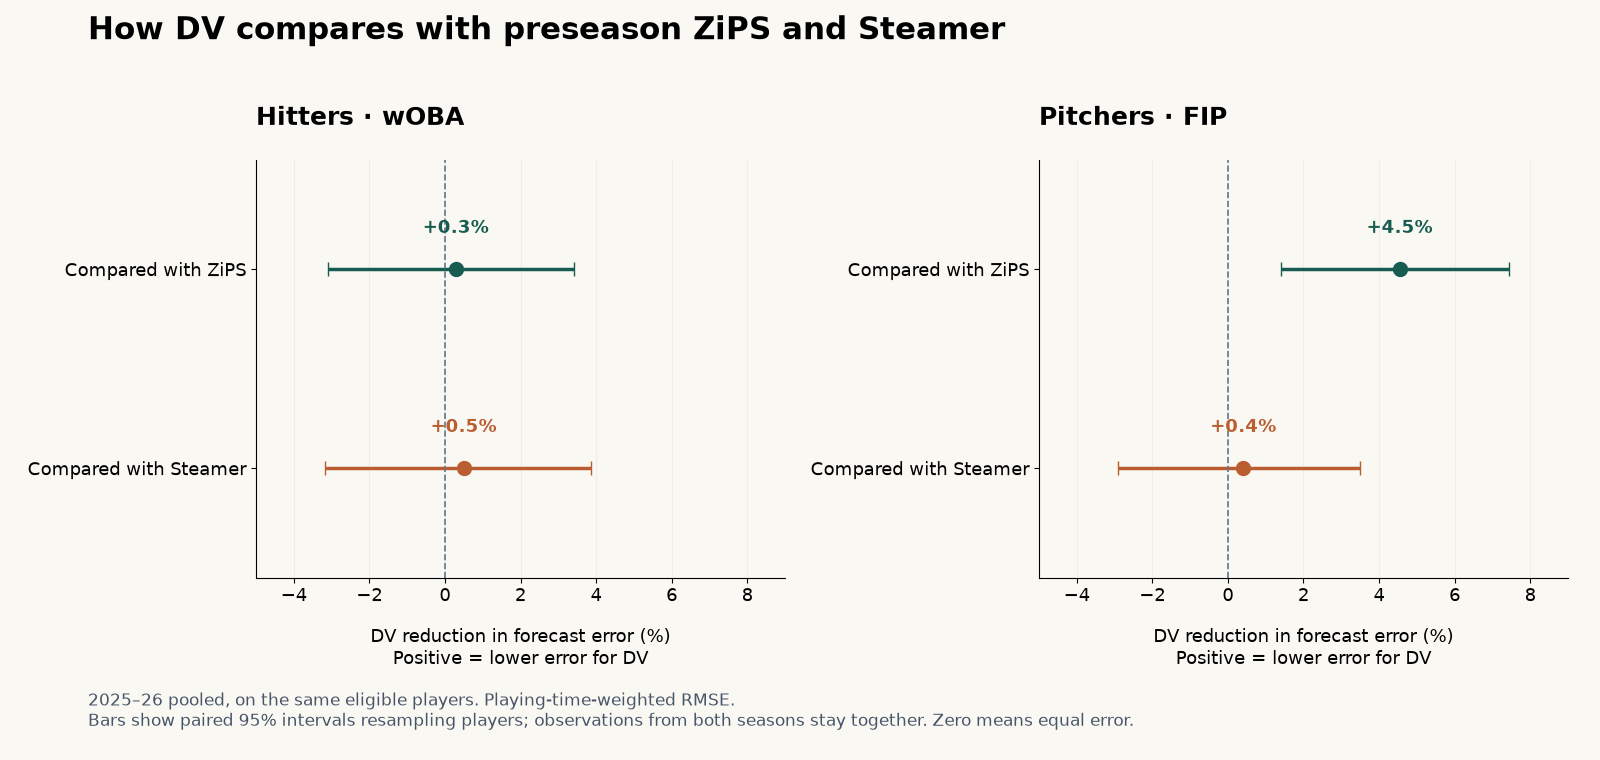
Not every secondary measure favors DV. Hitter strikeout-rate error was higher than ZiPS’s in the original benchmark, and Steamer had lower pooled ERA error. The detailed results include those comparisons as well as wOBA and FIP.
Testing a full season, including missed time
A rate test leaves out players who do not reach its playing-time threshold. I also tested total season WAR with no target-year PA or innings cutoff, including zero for established players who never appeared. That comparison uses each system’s preseason WAR forecast and gives each player equal weight. It tests the combined performance and workload estimate.
Across 1,210 hitter-seasons, DV with its expected workloads had WAR RMSE of 1.14, compared with 1.40 for ZiPS and 1.16 for Steamer. Across 1,584 pitcher-seasons, the errors were .80, .88 and .80. DV had lower error than ZiPS; its differences from Steamer were inconclusive. Using the fuller workloads chosen for valuation raised DV’s errors to 1.23 for hitters and .87 for pitchers, and overpredicted realized WAR. That is why I keep an expected-season forecast distinct from a full-season valuation.
A forecast for each year of a contract
For years two through five, I fit separate models to predict performance that far ahead. A player’s age and profile can therefore produce a different path from another player’s. The final rate blends 70% of the horizon forecast with 30% of the one-year forecast extended by the site’s fixed age adjustments, which depend on role and position. I keep the first year and smooth the later rates into a straight-line trend. Workload declines separately by role and age.
Update, October 30: the 30% piece originally used a historical aging curve estimated from consecutive seasons. In backtests with each forecast limited to information available at the time, the fixed age adjustments gave lower long-range error. For hitters, error fell 4.0% on forecasts made from 2018, 2019 and 2021 and 0.3% on forecasts made from 2022–24. For pitchers it fell 0.6% and 0.3%. The improvement grows with distance. The first projected season doesn’t change; later seasons rise by 0.03 to 0.09 WAR on average, and total surplus under DV Projections is about 14% higher than before.
Update, October 31: hitters now also have component projections: batting runs, baserunning runs, fielding runs at every position, and positional value. Fielding comes from each player’s FanGraphs fielding record, regressed toward average, with experience at other positions counting partly. I tested WAR built from those pieces against the direct WAR model on 1,506 hitter-seasons from 2022 to 2026, with the method and decision rule fixed beforehand. The composed WAR alone was slightly worse (RMSE 1.646 against 1.640 WAR per 600 PA). An even blend of the two was slightly better (1.637) and won four of the five seasons. So version 1.5 moves each hitter’s rate halfway toward his composed rate. The gain is small; the main use of the components is the depth chart, where a player’s projected fielding at each position replaces the defense from his 2026 role. Protocol, code and results.
Across 17 historical comparisons using 2024–26 target seasons, separate horizon models had lower WAR-rate error than a one-year forecast plus the historical aging curve in 16. The 70/30 blend had lower error in all 17. These comparisons reuse the same small set of seasons; they are not 17 independent future tests. The chart compares rates before final smoothing and workload assumptions. It is not a direct test against multi-year ZiPS, which I do not have archived.
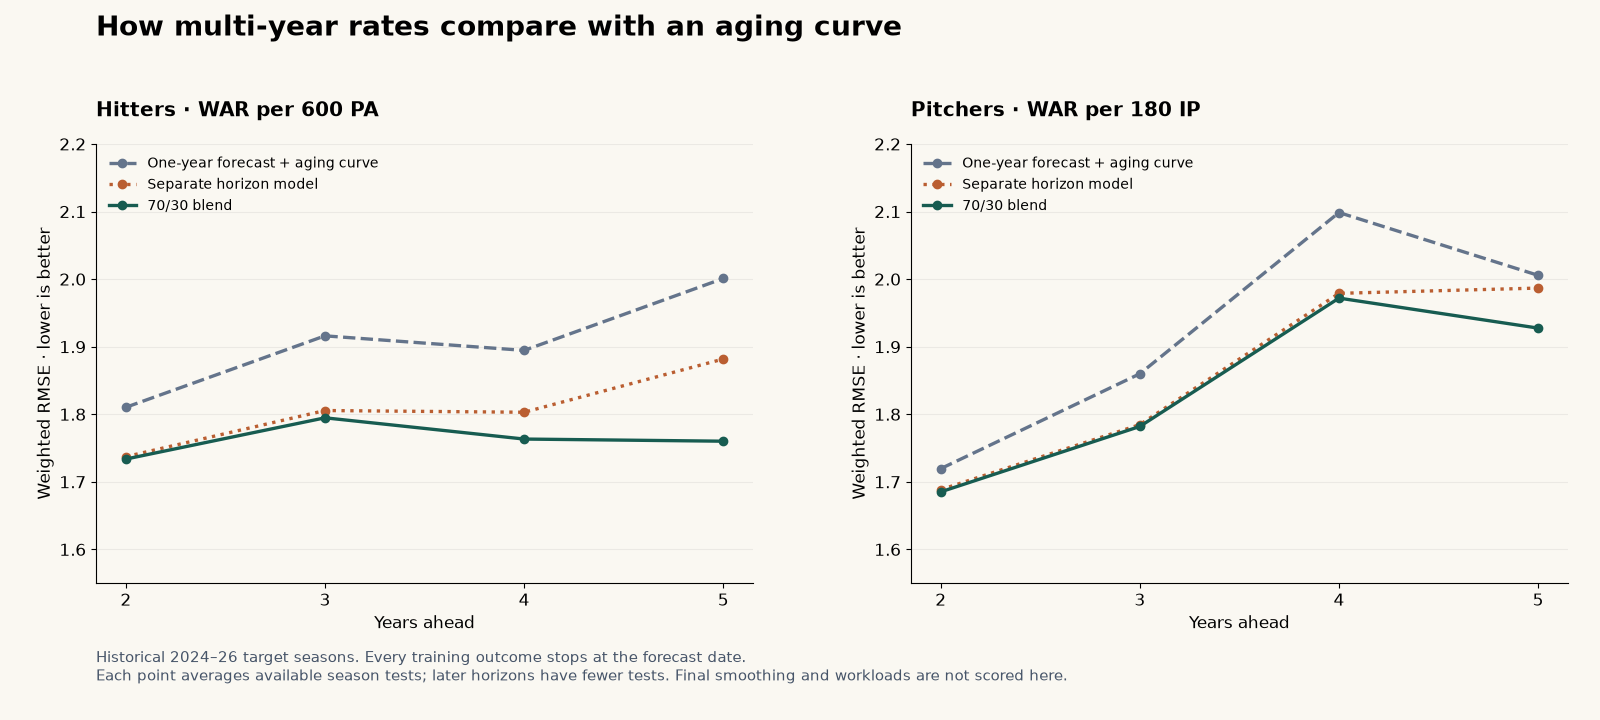
Long-range forecasts usually move exceptional players closer to average. That reflects uncertainty about maintaining an exceptional level as well as aging. It can reduce a young player’s estimated trade value considerably, even when next-year WAR changes little. A good average backtest does not make an individual five-year forecast precise.
What I take from the results
The strongest case for this system is practical: it uses current public information, separates performance from workload, and has been competitive with established forecasts in the comparisons available. It gives me an independent forecast built from current-season information.
I also checked projected rates against team wins, player run value and free-agent pay. Those are useful cross-checks, but they do not establish that a trade-value number is right. The original team-level results did not clearly separate the projection systems. Agreement with salaries measures what the market pays, not whether a signing was good.
The next prospective test is 2027. I plan to save DV, ZiPS and Steamer forecasts before the season, then score rates and total WAR separately afterward. The current historical tests have already been examined during this research, so they cannot substitute for that test.
Methods and data
Inputs are FanGraphs season leaderboards for 2010–26 and MLB Stats API minor-league statistics for 2013–26. Historical data were retrieved retrospectively and may contain provider revisions. The research download contains the original locked benchmark, additional validation, model code, data checksums and replay instructions. Later WAR and multi-year analyses use previously examined seasons. Players without sufficient MLB history retain ZiPS, and Teruaki Sato’s free-agent estimate uses a separate NPB translation.