I built a version of hitter WAR that combines the quality of a player’s contact with what happened after it. It starts with FanGraphs WAR, changes batting credit and keeps full credit for fielding, catcher framing, baserunning, position and replacement value. The result is DV WAR. Its strongest evidence is that batting information measured this way travels into the next season more reliably. That is useful, although it does not settle exactly how many past wins belong to each player.
What contact adds to the result
A hard line drive caught by a well-positioned outfielder and a soft single count differently in a box score. The outcome is real, but the hitter is one of several reasons it happened. Contact quality gives another view of his part in the play.
For each batted ball, a model estimates its run value from exit velocity, launch angle, spray direction, sprint speed, handedness and park. It is fit within the season using four folds, with each ball evaluated by a model that did not train on that ball. The hitter receives expected contact value plus half the gap between expectation and outcome. Walks, hit-by-pitches and strikeouts keep their outcome credit.
For example, suppose a hitter’s contact was expected to produce 20 runs above average but produced 12. Splitting that gap gives him 16 runs: 20 + 0.5 × (12 − 20). This credits more of the contact quality while retaining some of the outcome.
Expressed as a change to fWAR, it is half of expected minus actual contact runs, converted to wins. I center that adjustment per PA within each season before filtering the leaderboard, so the full league stays on fWAR’s scale. The formula changes how credit is distributed among hitters.
Fielding keeps full credit
DV WAR retains FanGraphs’ full fielding and catcher-framing components. A forecast of next year’s defense and an estimate of runs saved this year answer different questions. Fielding can be difficult to measure and can change from season to season; its limited persistence does not establish that half the runs credited this season should be removed.
Baserunning, positional and replacement runs also retain their full published credit. This is a batting adjustment built on fWAR. Pitcher WAR is unchanged, and this leaderboard covers hitters.
Testing whether credit carries forward
A player’s individual contribution is not directly observed. Team runs and wins are, so I test whether player credit helps explain team results outside the games used to measure it. These are transfer tests, with actual later playing time held fixed. They are not preseason forecasts of injuries, playing time or standings.
For the season-transfer comparison, I take each player’s prior-season WAR rate, apply it to his actual playing time with his next-season team and sum the results by team. The comparison covers the 2022–26 target seasons, or 150 team-seasons. Both versions use the same published pitcher WAR; only hitter batting credit changes.
Correlation measures how well the values rank teams by run differential. Prediction error is root mean squared error in runs per game, after a linear calibration fitted on the other target seasons. That calibration excludes the season being scored; it is not a strictly forward-only forecasting exercise.
| Measure | fWAR | DV batting adjustment, full fielding |
|---|---|---|
| Correlation, higher is better | .7265 | .7442 |
| Error in runs per game, lower is better | .5436 | .5277 |
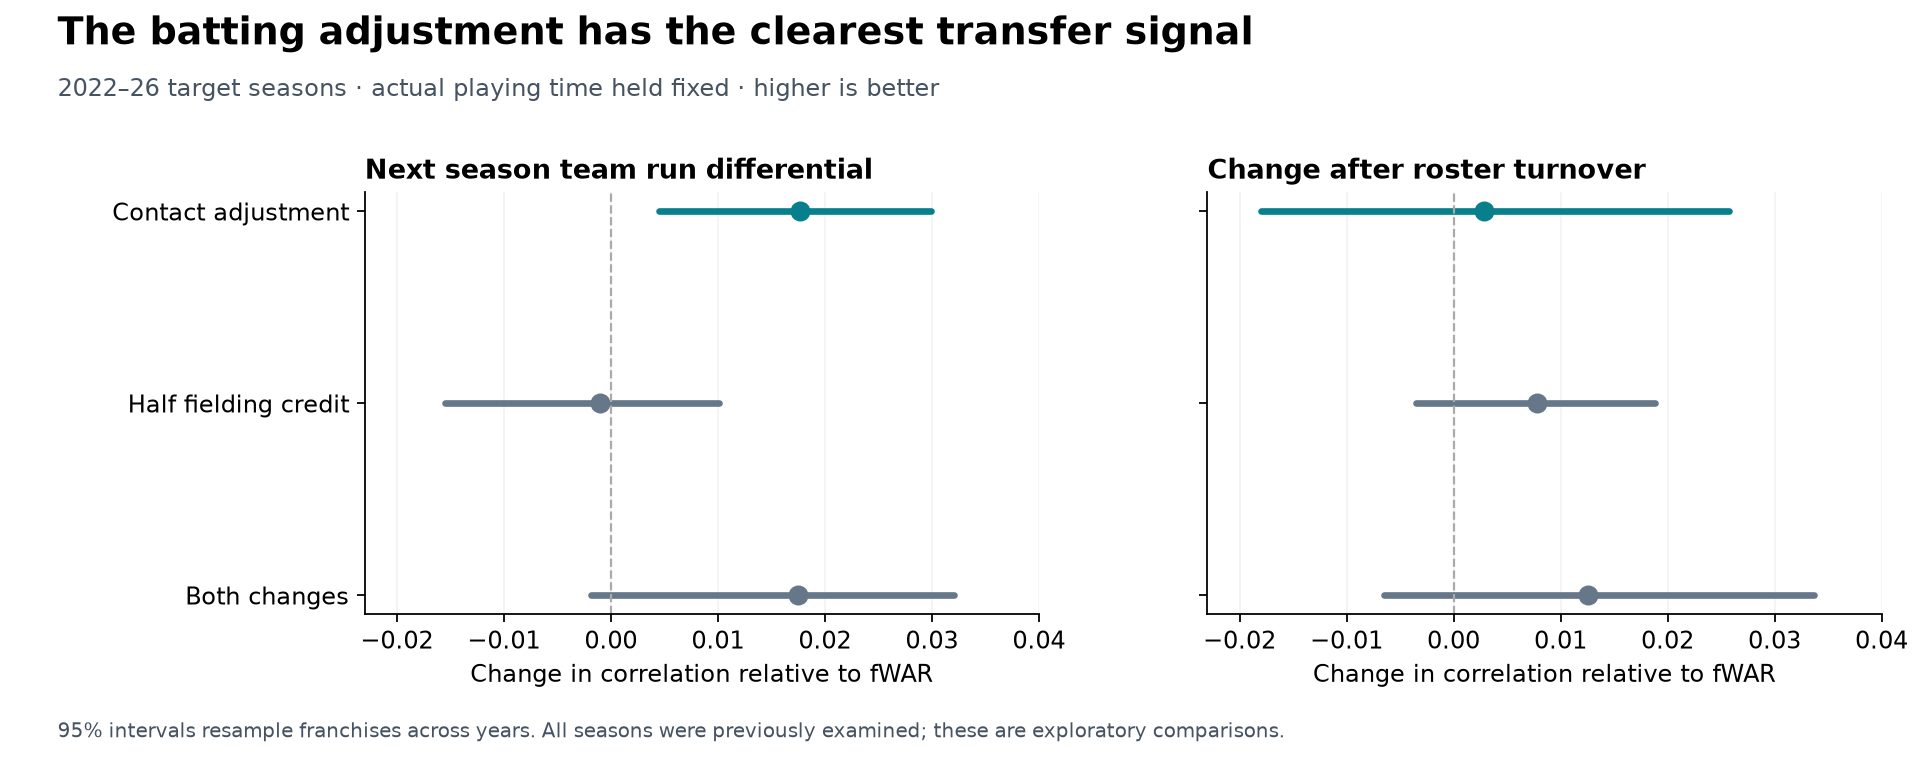
The adjustment lowers error by 2.9%. The correlation improvement is .0176, with a 95% interval of .0045 to .0299 when franchises are resampled across years. Resampling whole seasons also favors the adjustment, with an interval of .0001 to .0340. These intervals describe the fitted models and available seasons, not every source of uncertainty about future baseball.
The harder test is less decisive
The roster-turnover comparison asks whether prior player rates explain how a team improves or declines as players arrive, leave or change roles. For each player, I multiply his rate by the change in his playing time with that team, then compare the predicted team change with the actual change in run differential.
The contact adjustment scores .6128 against fWAR’s .6099. The difference is inconclusive: its 95% franchise interval runs from −.0180 to +.0257. Controlling for the prior team’s actual run differential also leaves the two versions very close. I cannot claim that this test establishes better attribution to the right individuals.
Splitting games within a season provides another check, but much of a team’s environment stays with its players across both halves. Replacing individuals’ rates with team-and-usage averages can retain much of that test’s accuracy. Good team-level transfer is evidence of signal, not a complete answer to who earned every run.
Useful information for forecasting too
I separately tested whether contact helps predict next-season batting runs per PA beyond ordinary regression toward average. A baseline calibrates prior batting results; a second model adds contact value. Both calibrations use only the development pairs ending in 2017, 2018, 2019 and 2021. Evaluation covers 2022–26 and requires 200 PA in each paired season.
Adding contact reduced batting-rate error by 3.8% across 1,334 player-seasons, with a player-clustered 95% interval of 2.6% to 4.8% better. It improved every test year. Among 314 observations of players changing their primary team, the gain was 2.0%, with an interval extending slightly below zero.
This calibrated forecasting model is distinct from the leaderboard’s fixed 50/50 value formula. The fixed formula itself forecasts less accurately than the calibrated results baseline. Contact provides useful information; that does not make a season-value statistic a complete projection system or establish a gain over the site’s existing projections.
What the evidence supports
I use DV WAR as an alternative view of hitter value supported by a competitive transfer result. I keep fWAR beside it, and the leaderboard shows the entire batting adjustment. The tests do not establish that every changed player ranking is correct or that DV WAR is the best measure of past individual contribution.
The contact-and-full-fielding comparison was examined after earlier historical results were available. It is exploratory evidence. The original locked study and its full results remain available separately; its broader specification and its salary and stability results should not be treated as tests of this exact leaderboard formula. The existing prospective 2027 experiment remains unchanged, and the additional contact candidate’s 2026 player snapshot is frozen for a future comparison.
Methods and data
Inputs are regular-season Baseball Savant pitch data, Savant sprint speed and FanGraphs season leaderboards. Expected-contact models are fit on the seasons being measured; historical inputs were retrieved retrospectively and may include provider revisions. Official team season runs supply the season-level targets. The research download contains code, input checksums, all fixed candidates, uncertainty estimates and replay instructions. Raw provider data are not redistributed. The leaderboard covers hitters with at least 300 PA in 2024–26.