Every bullpen is built around the same idea, that the best reliever pitches the ninth, and the standard analytical complaint is that this wastes him, because games are often decided earlier. The complaint is right about where the big moments happen. I went through every relief appearance from 2021 to 2026 and found that teams’ best relievers miss most of them. But when I tested rules a manager could actually follow, using only what he knew when he made the call, almost all of the apparent waste disappeared. I think the closer convention is closer to optimal than its critics assume, and that is why no team has found a lasting edge.
Measuring a big moment
Leverage index, or LI, measures how much a plate appearance can swing the chance of winning compared with an average one, which has an LI of 1.0. Leading off a tie game is about 0.9, and the bottom of the ninth, down a run with the bases loaded and two outs, is about 11. I built my own version from Statcast’s win-probability changes for every plate appearance from 2015 to 2026, and it matches FanGraphs’ published numbers closely: across 148 relievers in 2026, the correlation between my average LI and theirs was .997.
To judge who should pitch those moments, I used Dugout Value’s preseason projections, made before each season with only earlier data, because a reliever’s ERA over 60 innings is mostly noise. A team’s top two relievers are the two with the best projected FIP among those who faced at least 100 batters for it in relief. ZiPS projections give the same results.
Where the big moments are
Call a plate appearance high-leverage when its LI is 2 or more. In 2026, 58% of the high-leverage batters relievers faced came before the ninth inning: 24% in the eighth, 17% in the seventh and 10% in the sixth. Another 13% came in extra innings, and 29% in the ninth. Teams’ two best relievers faced 47% of the high-leverage batters in the ninth but only 23% of those before it, while relievers ranked sixth or lower on their own team faced 39% of all of them. And 47% of the batters the top two faced came with an LI below 1, mostly three-run ninths and clean innings to stay sharp.
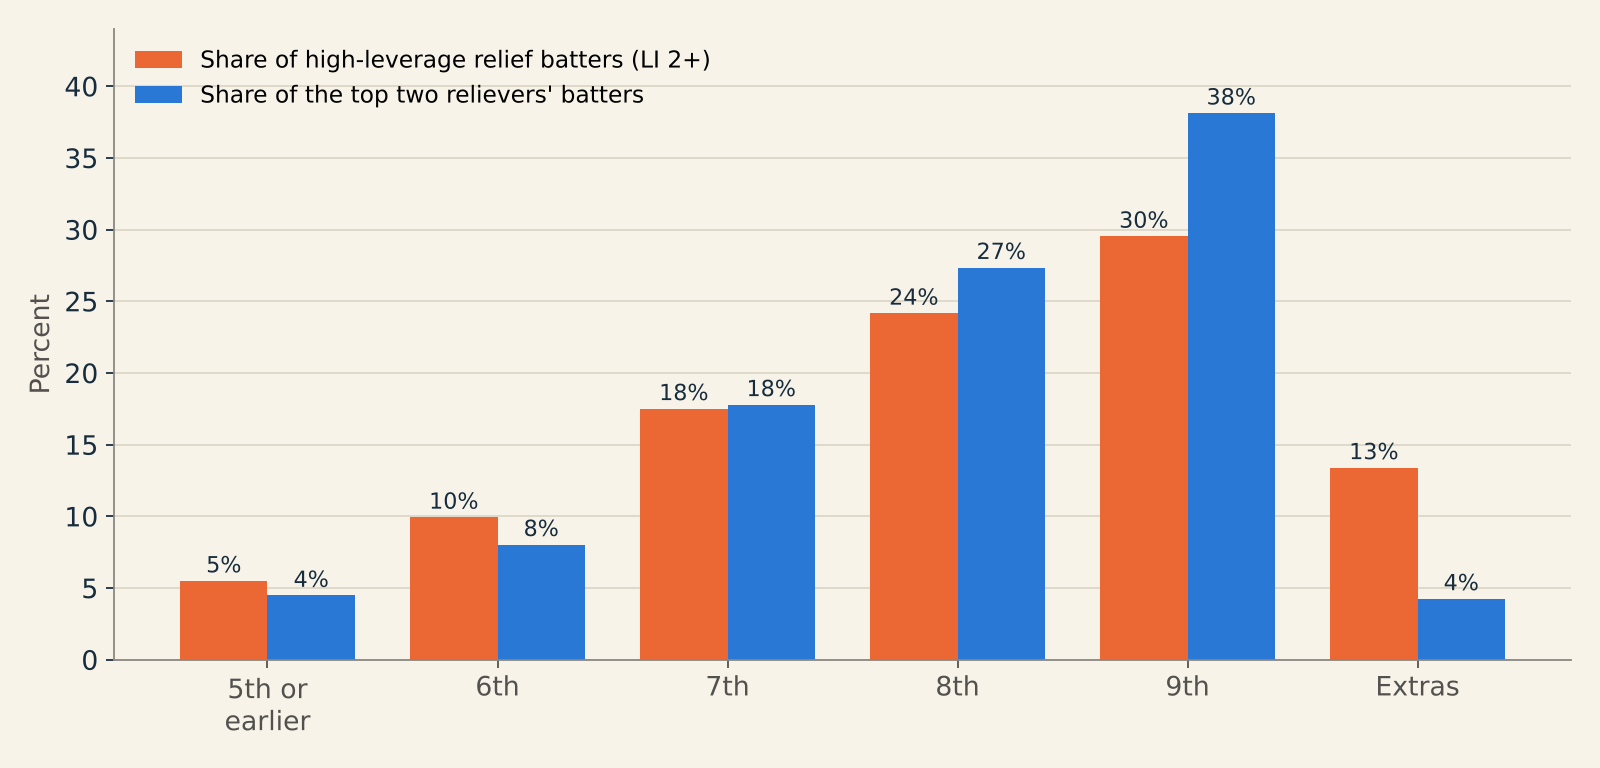
The pattern has barely moved since 2021: the top two relievers’ share of high-leverage batters before the ninth has stayed between 19% and 25% every year.
The cost looks large in hindsight
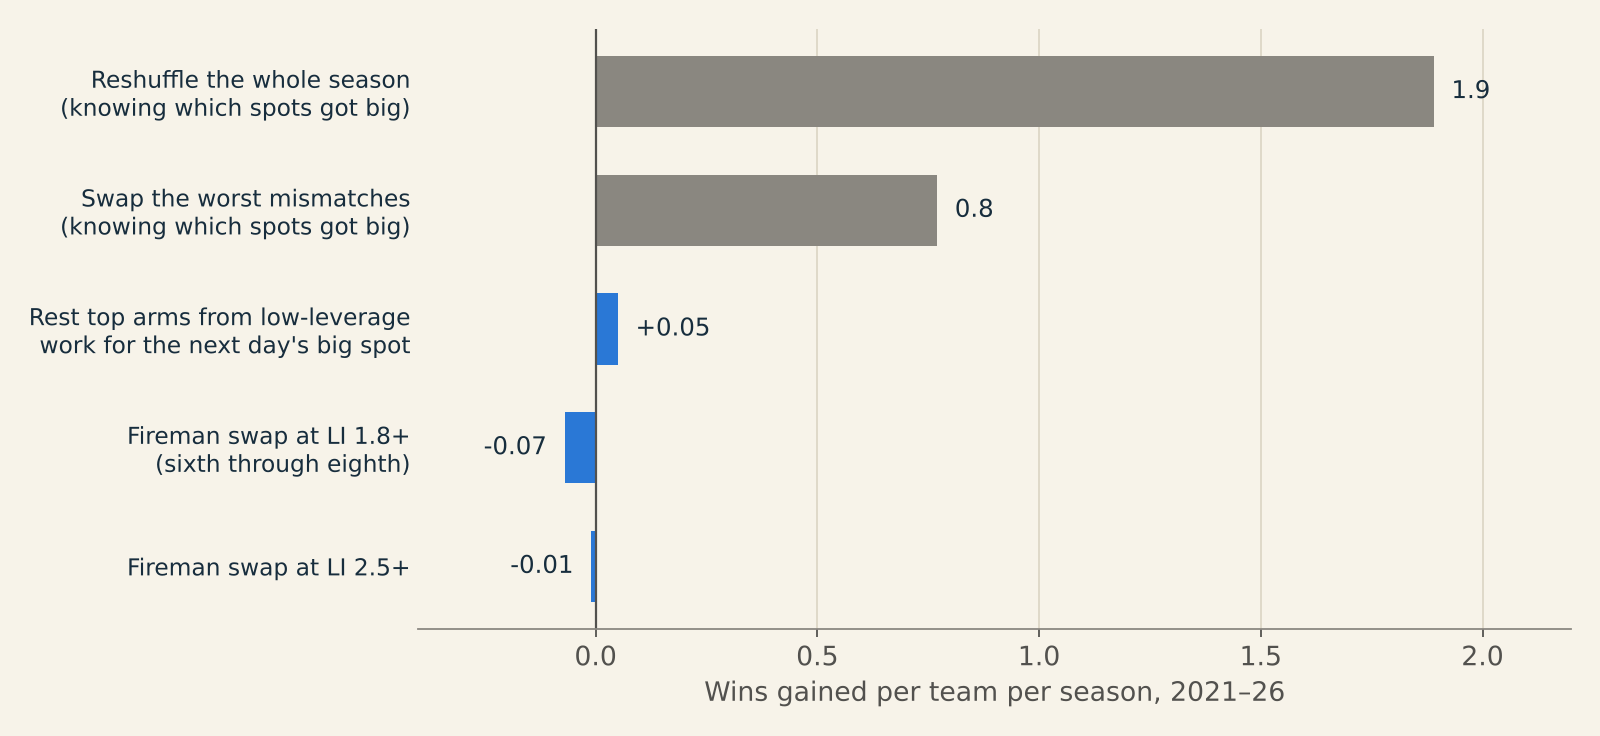
If each season could be replayed with each team’s highest-leverage batters given to its best relievers, holding every reliever’s workload fixed, the average team would gain 1.9 wins a year from 2021 to 2026. A narrower version that only swaps the worst mismatches, trading the top two relievers’ lowest-leverage batters for the highest-leverage batters faced by the sixth-best reliever or worse, still finds 0.8 wins a year from about 130 batters. Both numbers share the same flaw, because both use the leverage each plate appearance turned out to have, which the manager didn’t know when he chose his pitcher.
Rules a manager could use recover almost none of it
So I tested rules that use only what a manager knew at the time. The first is the fireman rule that analysts usually recommend: when a reliever enters a spot with an LI of 1.8 or more in the sixth, seventh or eighth inning, and a better reliever (by at least 0.30 of projected FIP, updated with his season to date) pitched later in the same game, swap their jobs. Keeping the swap inside the game means the better reliever was available that day. It lost 0.07 wins per team per season, and 51% of the swaps backfired. At stricter thresholds it broke even, losing 0.01 wins at an LI of 2.5 or more and essentially nothing at 3.0 or 4.0.
The reason is that a close game in the seventh or eighth usually stays close. In the games where the rule applied, the later appearance it would have handed to the lesser reliever carried more total leverage than the jam (9.2 against 7.9, summing LI over the batters faced), because a high-leverage ninth is a full inning while most middle-inning jams last a batter or two. The ninth is the one high-leverage inning a manager can see coming, and the closer is already there.
The second rule targets the low-leverage work. Top-two relievers make about 44 appearances a year at an entry LI below 1, and the usual rest rules mean some of those outings keep them out of the next day’s game. I counted the high-leverage spots that went to a team’s sixth-best reliever or worse the day after a top reliever pitched in a low-leverage spot, and valued the difference. It came to 0.05 wins per team per season, from about five such games.
Why no team is consistently good at it
I placed each team between the worst and best possible assignment of its own relievers to the situations it faced, from 0 to 100. Within a season, the score is consistent: two random halves of a team’s games agree at a correlation of .65. Across seasons it barely carries over, with a correlation of .14, and the part that measures how well a team matched arms to spots before the ninth carries over not at all (.01). Washington finished in the top 10 in five of six seasons, but with 30 teams there’s a 44% chance one of them does that by luck alone.
The consistent part within a season is mostly about roster. A team scores well when its best reliever happens to be its closer, which was true in 49% of team-seasons, and those teams averaged 65 against 61 for teams whose closer was their fourth-best reliever or worse. Rosters turn over, so that resets every year. The World Series teams show the range in 2026: Milwaukee, whose top two projected relievers both faced an average LI above 1.7, ranked fourth, and Tampa Bay, whose best projected reliever pitched mostly before the ninth at an average LI of 1.39, ranked 25th. If the gains a manager can see in the moment are close to zero, differences like that should come and go with the roster, and they do.
Where a team can still gain
The convention does cost something in situations a manager can see coming. A tie in the ninth is a slightly bigger spot than a save situation (average entry LI 2.26 on the road against 2.00 for a lead of one to three runs), yet road teams brought in a top-two reliever only 44% of the time, against 58% in save situations. They appear to be holding the closer for a save that only arrives if they score. In extra innings the first reliever enters at an average LI of 2.88, the highest of any regular spot, and a top-two reliever got that assignment only 28% of the time. In only about a quarter of the other extra-inning games had both of the top two already pitched earlier in the game, though some of the rest were unavailable after pitching the day before.
The other gain is in how teams read their own relievers. I split each season at July 15 and followed 487 relievers who threw at least 15 first-half and 10 second-half innings for one team. First-half luck, meaning runs allowed above FIP, barely moved their second-half leverage (0.036 of LI per run, interval 0.021 to 0.051), which is right, because it didn’t predict their second-half FIP at all. But relative to how well each one predicted the second half, managers gave first-half FIP about twice the weight of the preseason projection (1.9 times, interval 1.2 to 3.6). They see through ERA and still trust three months of results more than the evidence supports.
None of these is a two-win idea, and I haven’t estimated their value in wins. But they are the places where the information a manager has points to a better choice than the one he makes. The rest of the gap between bullpen usage and the leverage that actually arrived is the cost of not knowing when the big moment will come.
Methods in brief
- Data: Statcast pitch data for regular seasons 2015–26. Leverage uses 2015–26 excluding 2020; usage is studied for 2021–26, about 77,000 relief plate appearances a season.
- Leverage index: mean absolute change in win expectancy by inning (1–8, 9, extras), half-inning, score margin (−4 to +4), outs and runners, divided by the overall mean. States with fewer than 200 plate appearances borrow from the same state with innings 1–6 pooled.
- Talent: Dugout Value preseason FIP projections; the real-time rules also update each projection with season-to-date FIP, treating the projection as 60 innings of evidence. With ZiPS, the top two relievers faced 21% of high-leverage batters before the ninth in 2026 (23% with Dugout Value) and 40% in the ninth or later (also 40%), and the full reshuffle was worth 2.1 wins per team. Relievers without a projection, about 12% of relief plate appearances, are excluded.
- Value: a reliever saves (league FIP − his FIP) ÷ 9 ÷ 4.25 runs per batter, multiplied by LI; ten runs make a win.
- Plan: the leverage measure, the hindsight estimates, the team scores and the luck test were specified before any result was computed. The real-time rules, the repeatability checks and the tie and extra-inning comparisons were added afterward and are exploratory.
- Luck test: 903 pitcher-team-seasons, using entry LI, weighted by appearances; runs allowed are those scored while the reliever pitched. Intervals resample pitchers.
- Files: the plan, code and aggregate results are in the research files. Statcast and FanGraphs data and player-level rows aren’t redistributed.