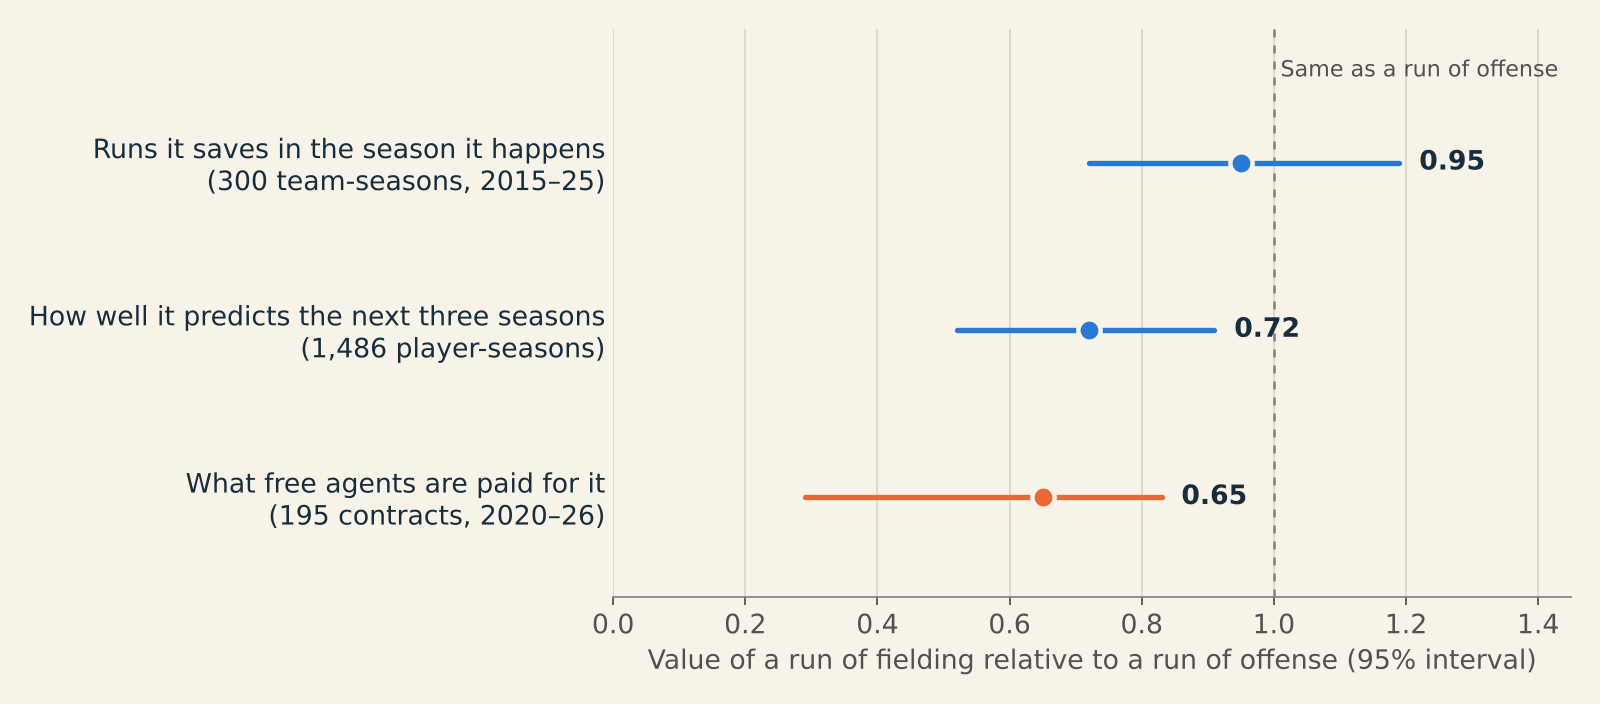
While building this winter’s free-agent contract predictions, I noticed that hitters whose value comes from their gloves sign for less than their WAR says they should. That looks like a market mistake, the kind a smart front office could exploit by buying defense cheaply. After digging into it, I think it mostly isn’t. Teams pay about two-thirds as much for a run of fielding as for a run of hitting, and a run of past fielding predicts about 70% as much future value. The runs themselves are real; they just don’t carry forward as reliably.
The discount is real
I started with 195 free-agent contracts signed by non-catchers from 2020 to 2026, each player with at least 1 WAR a season over his previous three years. For each one, I compared what he signed for with what the site’s trade model says his projected seasons are worth, then asked how much credit for fielding runs makes the model’s prices line up best with the actual contracts. Full credit fits worse than partial credit. The best fit gives a run of fielding 65% of the value of a run of offense, with a bootstrap 95% interval of 29% to 83%, after allowing for each signing year’s overall price level. Letting the model’s credit for offense move at the same time doesn’t change that: offense keeps full credit and fielding stays near two-thirds.
In dollars, that is a meaningful gap. A center fielder who saves 10 runs a year with his glove is about a win better than a hitter with the same bat at the same position, and the market pays him for roughly two-thirds of that win. At the model’s price of $11 million per win, that is about $4 million a season.
The runs are real too
One explanation would be that public fielding metrics overstate defense, so teams are right to ignore part of it. The team-level numbers don’t support that. Across 300 team-seasons from 2015 to 2025, leaving out 2020, each run of fielding a team’s players were credited with cut its runs allowed by 0.80, after controlling for its pitchers’ FIP. Each run of batting added 0.85 runs scored. A fielding run turns into an actual run prevented at about 95% of the rate a batting run turns into an actual run scored, with an interval of 72% to 119%. In the season it happens, defense counts about as much as offense.
Fielding doesn’t carry forward as well
The case for the discount is that a player’s past fielding is a weaker guide to his future than his past hitting. I took every non-catcher season from 2017 to 2023 with at least 300 plate appearances and compared each player’s previous three years with his next three. About 66% of a hitter’s batting edge, measured in runs per 600 plate appearances, carried into the next three years, while only 48% of his fielding edge did. Single seasons don’t show the gap, since fielding and batting are about equally stable from one year to the next, but fielding’s three-year track record regresses harder.
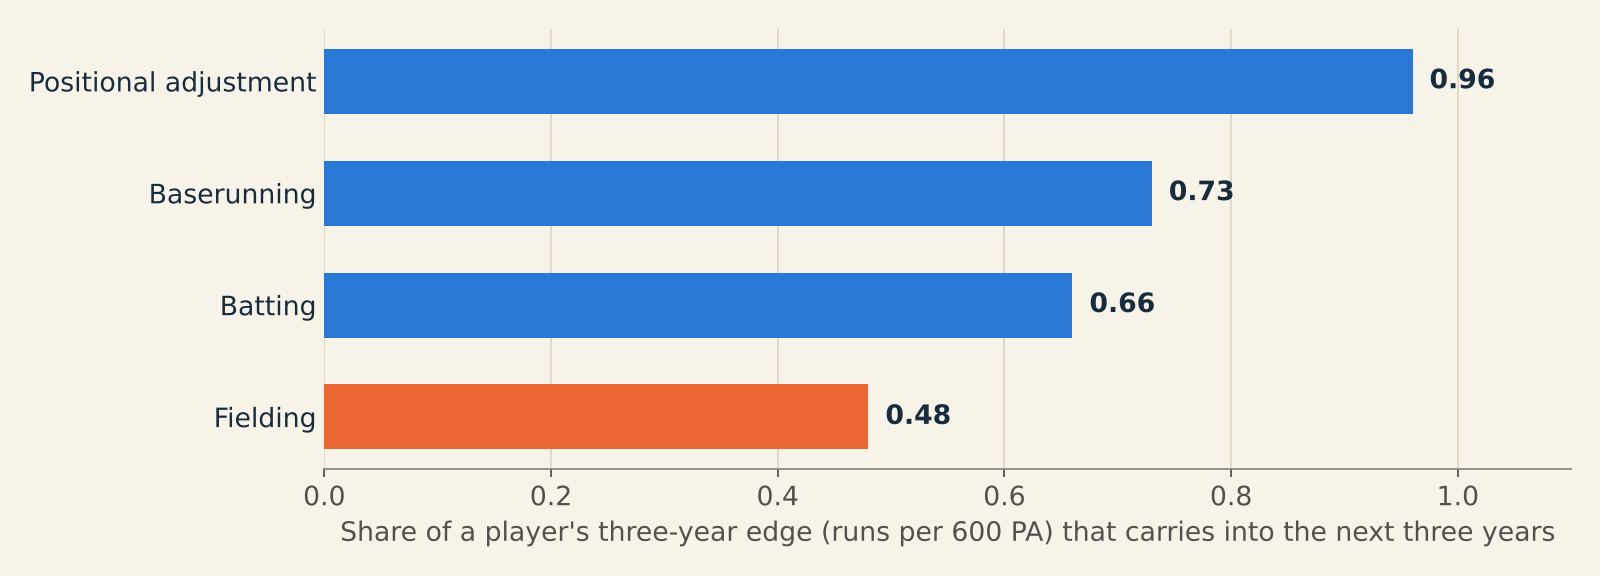
Playing time widens it. A glove-first player who stops hitting tends to lose his job, so past fielding earns fewer future plate appearances than past offense does: about 8 plate appearances over three years per run of fielding, against 15 per run of offense. Put the rate and the playing time together, and a run of past fielding predicts 72% as much future WAR as a run of past offense, with an interval of 52% to 91%. Aging isn’t the reason, because fielding fades more slowly than hitting. After 27, batting loses 2 to 5 runs per 600 plate appearances a year, while fielding loses less than one.
So teams are roughly right
Put the market’s 65% next to the 72% that fielding’s track record justifies and the gap mostly disappears. The intervals overlap almost entirely, so I can’t rule out a small undervaluation, but there is no sign of the large one the raw contracts suggested. Teams seem to treat defense the way the data says they should, as real value that is harder to count on.
One more test points the same way. Last winter’s free agents are the only class where FanGraphs recorded projections at signing, and projections already regress fielding. Priced on those projections, the 27 non-catcher hitters in that class show no extra fielding discount at all. That is a small sample, but it fits the idea that the discount is about uncertainty, not taste.
What this means for the site’s numbers
The trade model prices projected WAR, and projections already shrink a player’s fielding toward average, so it doesn’t need a separate defense discount and I’m not adding one. For the same reason, this winter’s free-agent contract predictions price projected fielding at full credit.
What I couldn’t test
I wanted to know whether the same pattern holds in trades, but a fair test needs each player’s value and each prospect’s grade at the moment of the deal. The site’s archived snapshot from July 31, 2026 covers only one deadline, which produced six usable hitter trades, too few to say anything. The cleanest test would log every deal with the model’s values as it happens and check the pattern after a full season of trades.
Methods in brief
- Data: FanGraphs leaderboards for 2015–26 (batting, baserunning, fielding and positional runs, WAR and team totals) and FanGraphs’ free-agent tracker for 2020–26 contracts. Catchers are excluded throughout, because framing makes their defense a different measurement problem.
- Contracts: 195 non-catcher deals with three-year WAR of at least 1 and at least 250 PA a season, valued in 2026 dollars. The fielding credit is the one that minimizes the spread of log(actual ÷ model) after removing each signing year’s mean.
- Prediction: three-season WAR after each 2017–23 season regressed on the previous three seasons’ offense, fielding and positional runs per 600 PA, age and playing time (1,486 player-seasons).
- Team check: runs allowed on FIP-based runs and team fielding runs; runs scored on batting and baserunning runs; both with season effects.
- Status: exploratory and not pre-registered. Scripts and printed results are in the research files; the FanGraphs data isn’t redistributed.