Some hitters consistently swing at hittable pitches and lay off the rest, and that skill shows up in the data faster than almost anything else we can measure at the plate. What it buys a hitter is harder to pin down. For five seasons, the clearest payoff came against the best pitchers in the league: from 2022 to 2026, good deciders gave up far less ground than everyone else against the hardest-to-hit fifth of the league, most of them relievers. I wanted to know whether that would hold up on seasons I hadn’t looked at, so I tested it on the 2021 regular season and six postseasons.
What I found
- Swing-decision skill is stable. Half a season of a hitter’s decisions predicts the other half with a reliability of 0.84 at 300 plate appearances, about the same as chase rate and strikeout rate, while wOBA manages 0.2 to 0.3 on the same test.
- From 2022 to 2026 it paid off against elite pitchers. Each standard deviation of decision skill was worth about 5 extra wOBA points against the hardest-to-hit 20% of pitchers, beyond its value against everyone else, and the effect was positive in all five seasons.
- The test on new data didn’t reproduce it. In the 2021 regular season and the 2021–26 postseasons, the estimate was −1.4 wOBA points, with a 95% interval of −7.5 to +4.6, which rules out the size the earlier seasons suggested but leaves room for a small positive effect.
- Decision skill hasn’t improved a forecast. In the original study it didn’t earn hitters better pitches, didn’t predict better contact and didn’t add anything to a wOBA forecast that already knows strikeout, walk, swing and contact rates.
Measuring decisions
The measure comes from a pre-registered study of plate-appearance quality that I locked on October 23. It grades every pitch in runs against a reference: what the league does with the same pitch, in the same location and the same count. Take a pitch the league swings at 70% of the time, where swinging is worth 0.03 runs more than taking. A hitter who swings gets credit for the 30% of the decision the league tends to get wrong, or 0.3 × 0.03 = 0.009 runs, and a hitter who takes is charged for the other 70%. Summed over a season, that’s his decision value.
The measure credits a disciplined take and an aggressive swing at a hittable strike the same way, and it ignores what happens after contact. The spread among regulars is meaningful: one standard deviation is about 0.32 runs per 100 pitches, or roughly 7.5 runs over a full season of decisions.
Where the edge showed up
The original study asked five questions, and most came back null. The exception was elite pitching, which I defined in advance as the 20% of pitchers whose stuff was hardest to swing at profitably the season before. In the 2025 and 2026 test seasons, decision skill was worth about 6.6 extra wOBA points per standard deviation against those pitchers (95% interval 3.5 to 9.6), and the result cleared the study’s multiple-testing correction.
I then went back through 2022–26 to find out what drove it. That work was exploratory, about 80 specifications on seasons I had already used, and the picture it produced was sharper than the original result.
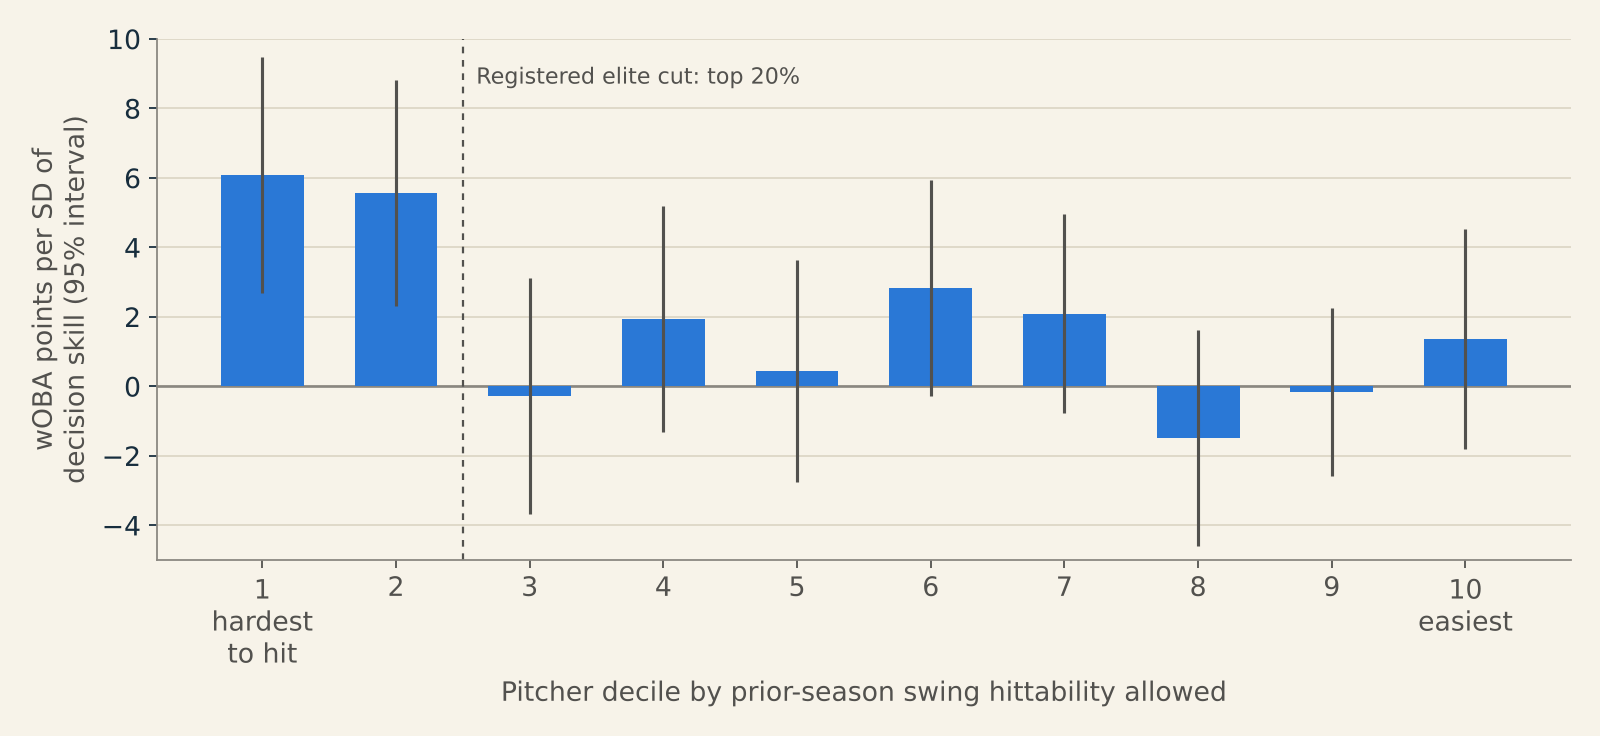
The edge appeared only at the top of the scale. Decision skill was worth about 6 wOBA points per standard deviation against the two hardest-to-hit deciles and about zero against the other eight. Four in five of those pitchers were relievers, averaging 95.4 mph with a 30% whiff rate and a 10.3% walk rate. When I ranked starters only against other starters, the edge disappeared.
It also wasn’t simply chase rate. O-Swing% on its own carried about 70% of the effect, but with both in the same model, decision skill kept its full size and chase rate dropped to zero, because the measure also rewards hitters for staying aggressive on hittable strikes. Most of the runs came on contact: against those pitchers, the bottom third of hitters by decision skill lost about 21 wOBA points against their own baselines and the top third lost about 10. About 60% of that gap was quality of contact, about 20% was walks and about 13% was strikeouts, and the better deciders weren’t getting better pitches to hit, which suggests they were doing more with the same ones.
The explanation was plausible enough: elite relievers punish a bad swing decision harder, so hitters who make fewer of them hold up better. The result survived dropping 2026, the first season with the automated strike zone, controls for hitter quality in deciles, fixed effects for every hitter-season and pitcher-season, and a switch from expected to actual wOBA. Surviving those checks on the same seasons, though, doesn’t show that the effect generalizes, which is why I tested it somewhere else.
Testing it on seasons I hadn’t used
By then every season I’d examined was used up, but two pieces of data remained that no analysis of this question had touched. The 2021 regular season had been scored by the study but never used to fit the elite-pitching model, and its elite list comes from the 2020 season, which I hadn’t downloaded. The study had also filtered out every postseason game from 2021 to 2026. The 2026 postseason is still going, so I set a cutoff of games through October 23.
I wrote down the test and recorded the file’s checksum at 4:39 p.m. ET on October 24, before downloading either dataset. The protocol fixed the model, the sample, the pass rule and how I’d read each possible outcome. For postseason games, it froze every input at the end of that regular season, so no postseason pitch could feed the predictors. It also stated the power in advance, which was about even odds of detecting an effect of the expected size.
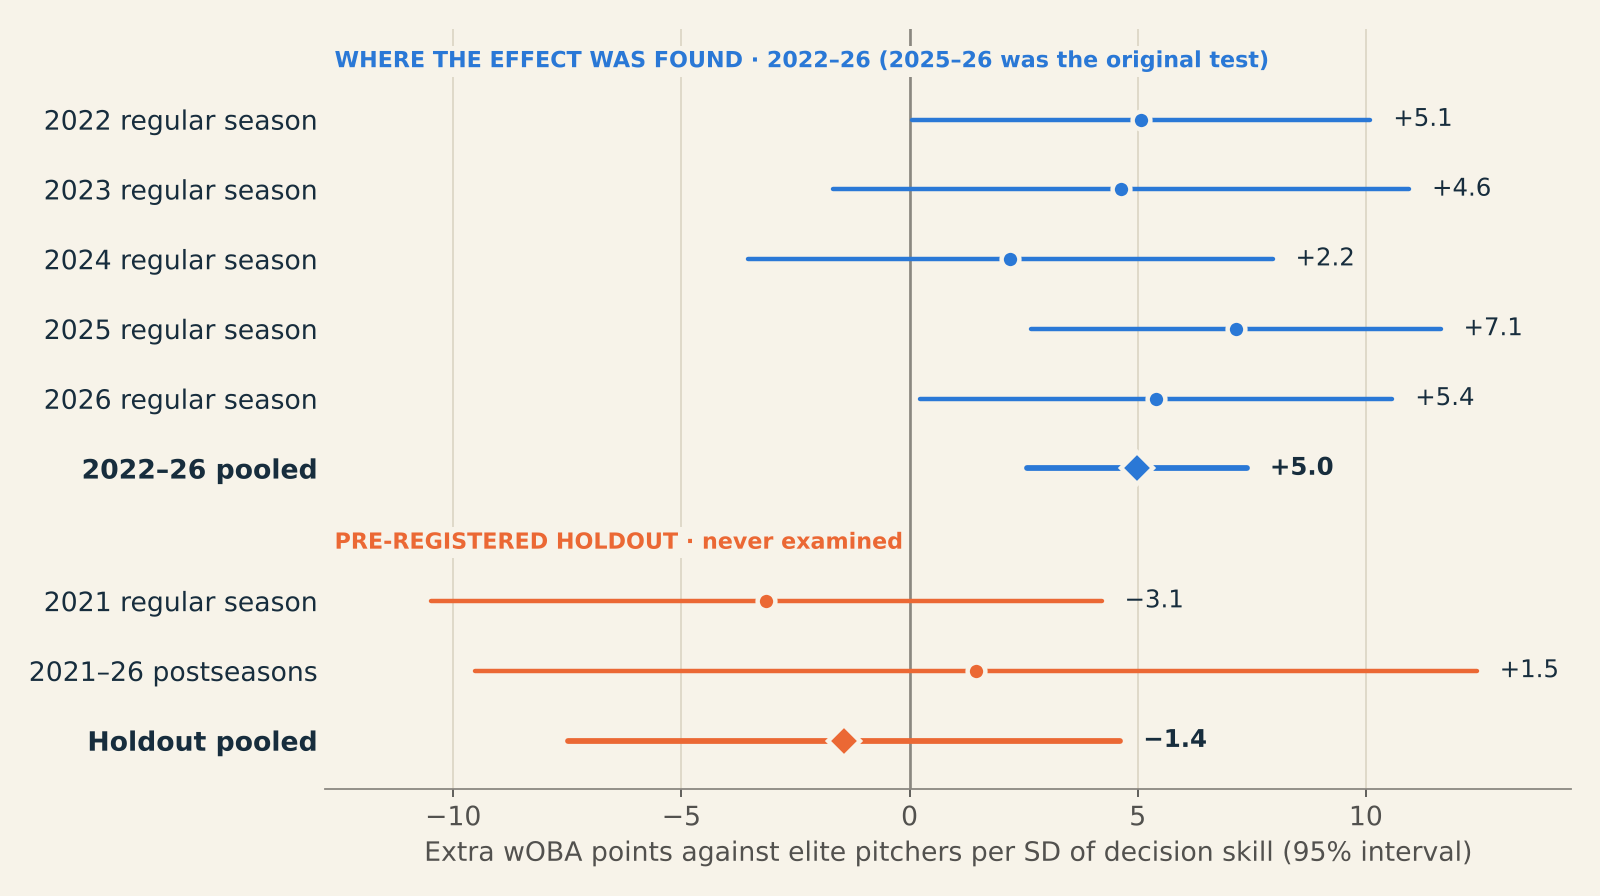
| Sample | Estimate | 95% interval | Plate appearances |
|---|---|---|---|
| 2021 regular season | −3.1 | −10.5 to +4.2 | 106,559 |
| 2021–26 postseasons | +1.5 | −9.5 to +12.4 | 16,900 |
| Pooled holdout | −1.4 | −7.5 to +4.6 | 123,459 |
| Relievers only (registered secondary) | −2.8 | −10.8 to +5.3 | 41,214 |
The effect didn’t show up in the holdout. A pass required a pooled one-sided p-value under 0.025 plus a positive estimate in both the 2021 block and the postseason block, and the test missed the first two, with a pooled p-value of 0.68. The relievers-only version, where the exploratory work said the effect was concentrated, came out negative as well. A separate verification pass, independent of the code that produced the result, rebuilt the test from scratch and reproduced every number. It also confirmed that the protocol was followed, that the postseason game counts match the public record and that no postseason information leaked into the inputs.
What to make of it
Under the rules I set in advance, a pooled estimate at or below zero counts as evidence against the effect at the planned size, and that’s where this landed. The test was weaker than I’d planned, with 37% power to detect a 5-point effect rather than the projected 52%, mostly because the 2021 estimate was noisier than expected. That would matter more if the 2021 estimate were a weak positive, but it was negative, and the interval excludes the size the earlier seasons pointed to.
2021 is about two standard errors away from the 2022–26 pool (two-sided p = 0.04), though the variation across all six seasons isn’t significant (p = 0.29), so it could be an unlucky season or an accurate one. The short 2020 season doesn’t explain it either. I worried that 60 games made for a poor elite list, but every version built from 2020 came out negative, as did one built from 2022. Defining elite from 2021 itself gave about +0.8 points, still near zero, and that version uses the same season’s outcomes, which the registered test avoided on purpose.
The original 2025–26 test passed under its own rules. The exploratory work that followed looked at those same seasons from many more angles, and each angle made the effect look more specific: the step at the top 20%, the bullpen concentration, the contact story. The holdout is the only read I have that’s independent of all that, and it puts the payoff below what I expected, possibly at zero.
Where that leaves decision value
The measure itself has held up throughout. With a 0.84 split-half reliability at 300 plate appearances and steady year-to-year numbers, it’s among the most reliable things you can measure about a hitter, and it isn’t just chase rate under another name: after removing chase, zone-swing and contact rates, it keeps a reliability of 0.6 to 0.7.
So far it hasn’t added anything the usual numbers miss. Good decisions didn’t earn better pitches, didn’t predict better contact and didn’t sharpen a wOBA forecast that already knows a hitter’s strikeout, walk, swing and contact rates, and the one matchup where they seemed to matter more didn’t reproduce on new data. For now, decision value is best used to describe how a hitter works an at-bat rather than to project what he’ll do next.
What’s next
The next independent test is the 2027 regular season. If the effect is real at the size the earlier seasons suggested, a full season gives roughly even odds of detecting it, and pooled with this holdout it should settle the question much more clearly.
Methods in brief
- Data: Statcast pitch-level data from Baseball Savant, 2020–2026. The 2020 data was used only to build the 2021 elite list.
- Decision skill: P1, swing-decision value against a league reference, in runs per 100 pitches. Pre-game values are shrunk toward zero with a ballast of 1,000 pitches. One SD is 0.154.
- Elite pitchers: the bottom 20% by prior-season mean swing hittability, among pitchers with at least 300 pitches. For the postseason, the same season’s regular season is used.
- Model: a PA’s xwOBA minus a log5 expectation built from shrunk hitter xwOBA and pitcher xwOBA allowed. Controls are handedness, times through the order, starter or reliever, park, and hitter xwOBA × elite. Standard errors are clustered by hitter and pitcher. One run per PA is 1,250 wOBA points.
- What’s published: both protocols with their checksums, the implementation decisions, the results and both independent verifications are in the research bundle. The original study’s reliability results are summarized in its results report.
- Individual hitters aren’t named. A hitter’s own split against elite pitchers had a reliability of 0.02 to 0.2, which is mostly noise.
Related: Three Statcast ideas that didn’t improve the forecast.